A Collaborative for Latinx Equity.
Our Mission.
To build a university-community network using diverse knowledge and expertise to collaboratively create and disseminate quality, actionable information and strategic solutions that foster equitable health outcomes for Latinx communities.
3 Trends this week, through the Latino lens
-
Low rates in top 25 cities and towns with 75% of all Latino residents
Analyzing the top 25 Latino cities in Massachusetts, that is, the 25 cities with the largest Latino populations in the state, the gap between the fully-vaccinated rate for Latinos and other groups is still large. Although Latinos account for almost 25% of the population in these cities, being the largest non-white group, the fully-vaccinated rate for Latino residents at 35% is below the overall rate for the 25 cities (at 53%). Similarly, the Latino rate is 24 percentage points below Asian residents, who account for only 7% of those cities populations, and 21 percentage points below white residents.
July 16, 2021
-
Baixo índice de vacinação na população latina
À medida que os índices de vacinação aumentam em Massachusetts, a tendência de baixa vacinação da população latina continua evidente. Segundo os últimos números, do dia 06 de julho, embora 59% dos residentes de Massachusetts já estivessem completamente vacinados, apenas 40% da população latina já havia recebido a imunização completa. Também se compararmos os diferentes grupos étnicos/raciais, os latinos figuram 19 pontos abaixo dos asiáticos, 17 pontos baixo dos residentes que se declararam brancos.
As razões para tal disparidade são de diversas ordens, o que indica que a solução é multifatorial, e deve ser buscada dentro do contexto da tradicional desigualdade nas condições socioeconômicas e de acesso à saúde ao bem-estar dessa população latina no estado.
July 16, 2021
-
Ethnicity Misidentification
The city of Lawrence, that has 80% of Latino residents, has the lowest rate of fully-vaccinated Latinos, at about 20%. However, the rates for White, Black, and Multiracial residents are above 100%, respectively 127%, 153%, and 164%. This seems to imply that the low rate for Latinos could be explained by a misidentification of the vaccinated residents as the overall rate for the city, at 44%, is comparable to nearby cities as Holyoke and Lowell.
July 16, 2021
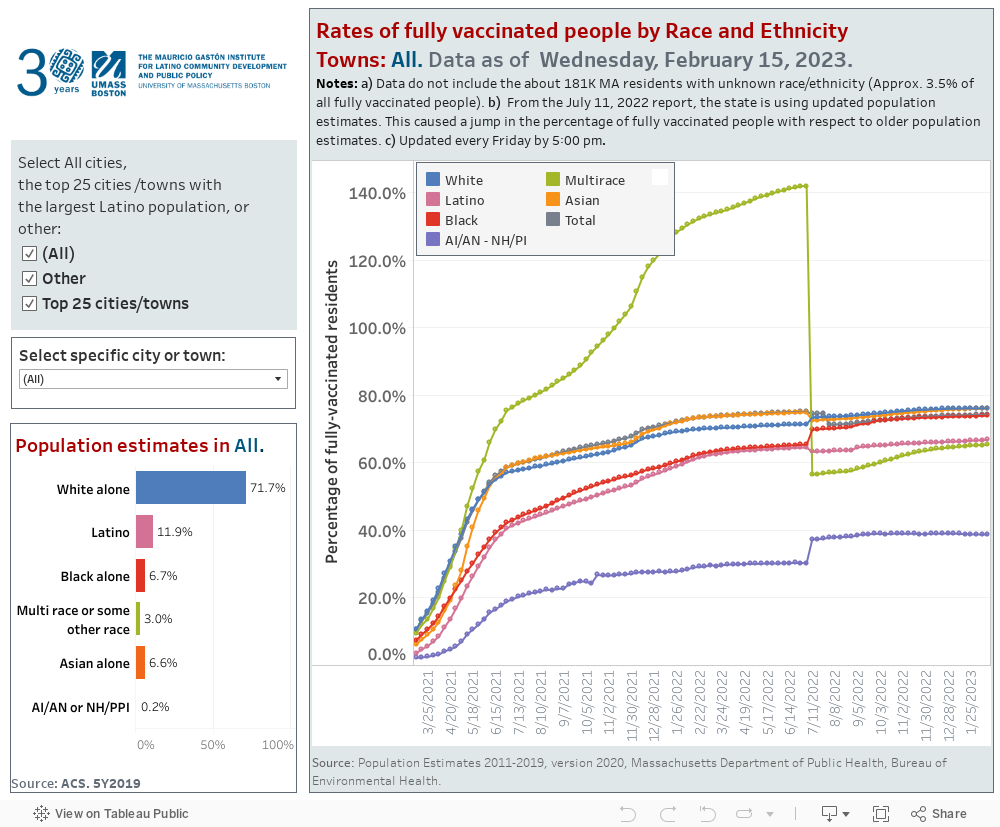
Vaccination rates over time, by race/ethnicity.
Why this interactive Dashboard
This dashboard allows you to visualize across time the gaps in fully vaccinated rates for each race/ethnicity group, allowing a better understanding of the racial/ethnicity trends in vaccine rates in Massachusetts.
How to use this interactive Dashboard
You can visualize the data across all cities in the state, the 25 top cities/towns with the largest Latino populations, or other cities (outside the top 25). You can also visualize the data city by city. You can click on each race/ethnicity legend to select only one racial or ethnic group. Use Ctrl key to select more than one.
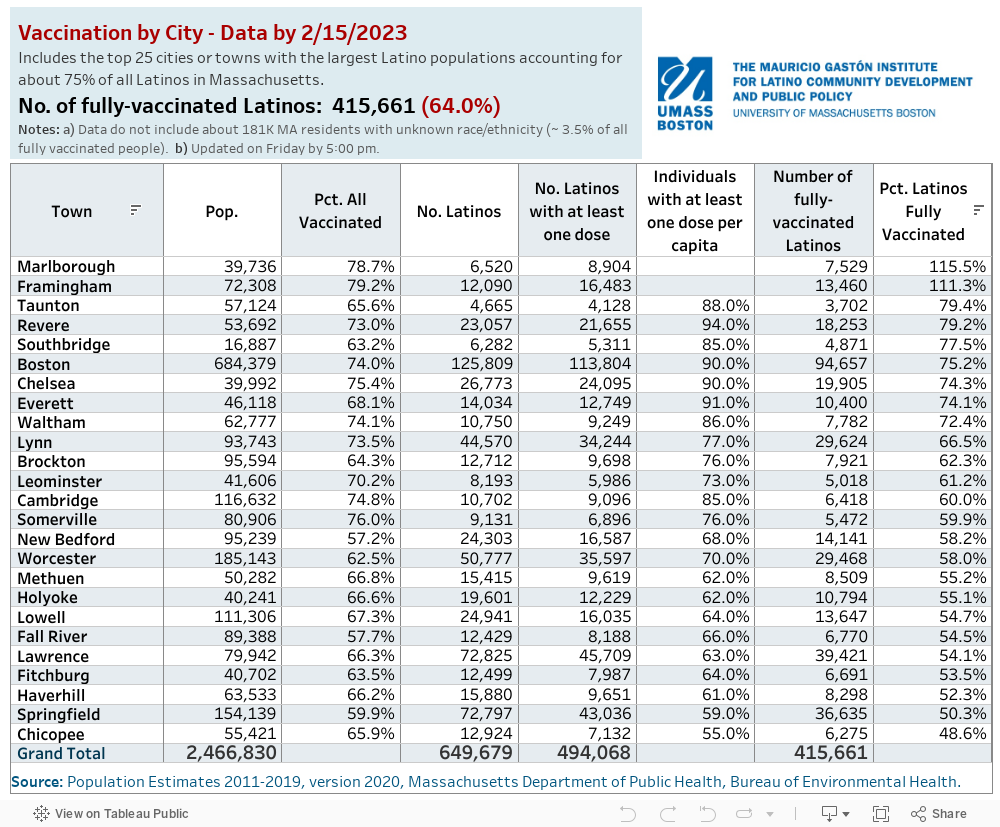
2. Vaccination rates in the 25 top Latino cities in MA
Why this interactive Table
This table allows you to compare the most up to date vaccination rates in the top 25 Latino cities in Massachusetts, that is, the 25 cities with the largest Latino populations in the state. The data is updated weekly.
How to use this interactive Table
By clicking on the sort symbol on top of each column, you can organize the data by population, no of Latinos, rates of vaccination, etc. This allows you to compare each city in relation to the others, according to the latest data released by the MA Department of Health.
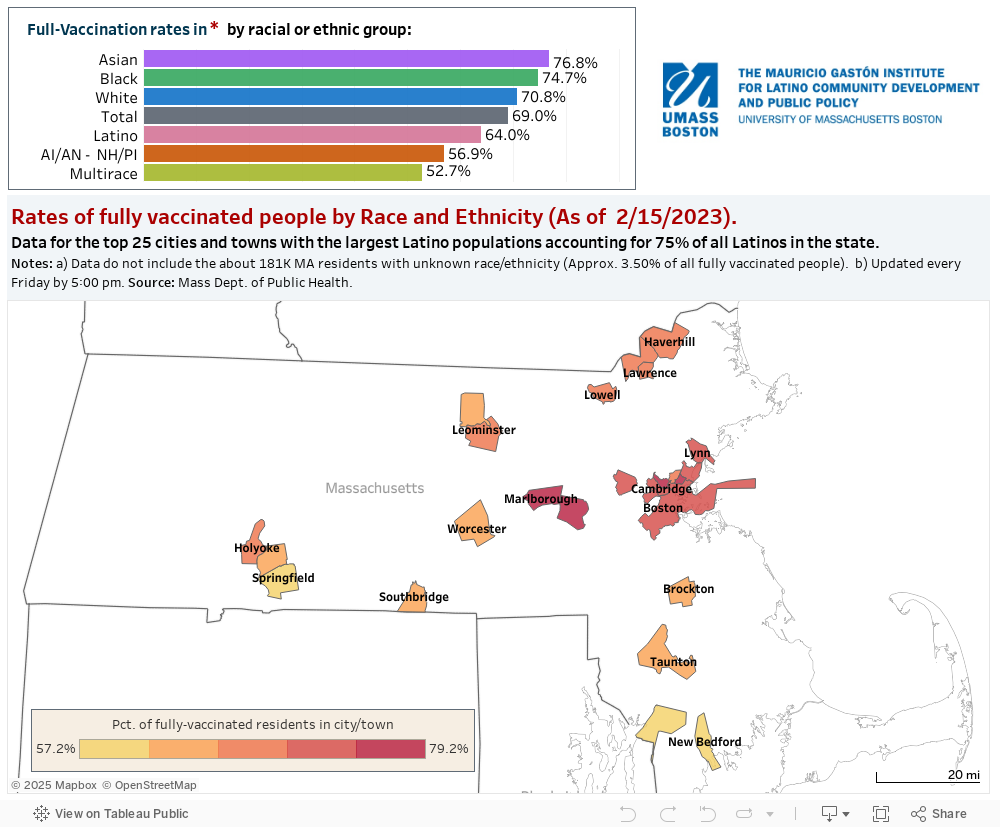
3. Map of the top 25 Latino cities with vaccination rates by Race/Ethnicity
Why this interactive Map
This map of Massachusetts shows the rates of fully vaccinated people by Race and Ethnicity, for the top 25 cities and towns with the largest Latino populations, in the present moment. Its visualization allows to compare fully-vaccinated rates according to race and ethnicity in each one of the 25 top Latino cities, according to the latest data released by the MA Department of Health.
How to use this interactive Map
This dashboard displays the geographical distribution of the top 25 cities/towns with the largest Latino populations. You can use the mouse to select a city and explore rates of fully-vaccinated residents for each racial and ethnic group in the city. Using Ctrl+click you can select more than one city and the vaccination rates will be aggregated for the selected cities.
Humanize Data and offer Guidance.
The Collaborative is available for consultation.
Call us to discuss.


Co-create Knowledge and Impact.
The Collaborative is an active group that engages with researchers, community and legislatures. If you need perspective on these issues we are here to help.


Share to Mobilize Action.

Resources
The Hub in the News
Outreach and Advocacy
Speaker Series and Roundtable Events
Share content, help the community, follow us to stay updated.