Inform. Help. Change.
Map of MA reference for home page if needed.
Why this Dashboard
In an effort to respond to the informational gap about Latinx population, the Hub brings this dashboard, which focus on trends of Latinx across the state. Using data provided by the government, this initiative aims to use Latinx lenses to analyze numbers, find trends, and provide information tailored to bring awareness and service to both ordinary people and as well as groups involved with Latinx equity, as Community Based Organizations, policy makers and governments at the state and municipal level.
How to use this Dashboard
Each week the Hub Collaborative and or it’s partners will analyze the data provided by the government, and present it’s analysis to help bring about change.
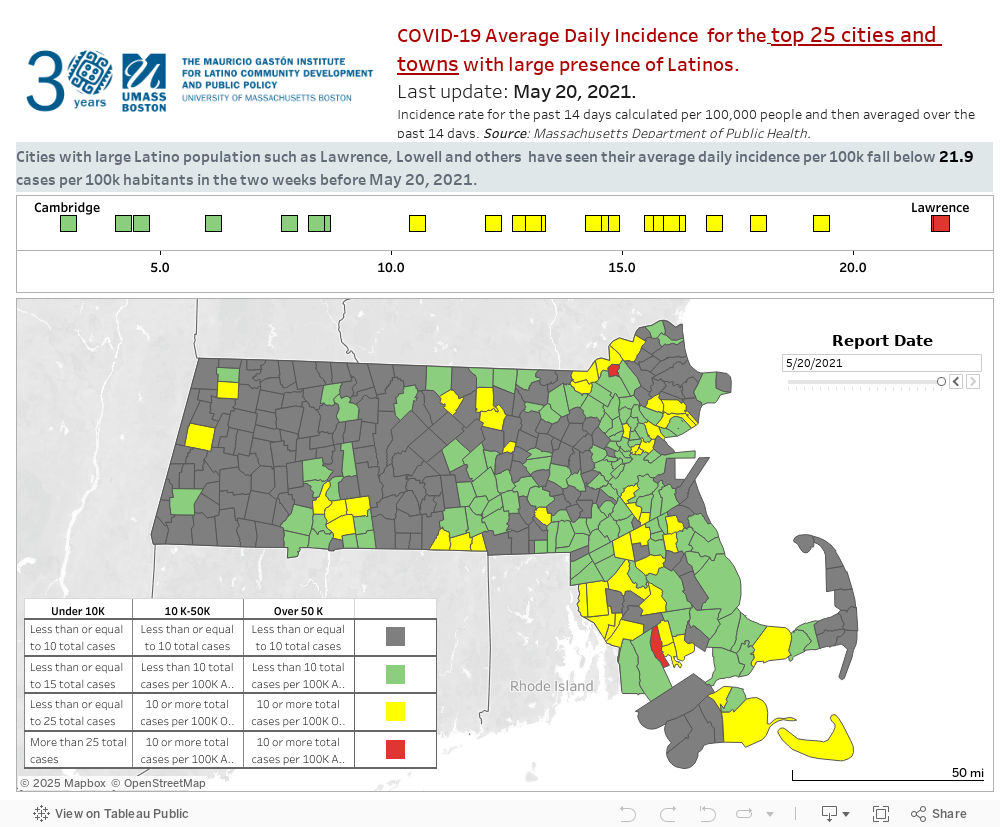
The chart on the left shows “xyz…………………………”. But you can also use this to view “xyz………………………” by selecting different cities from the dropdown menu; or view the comparisons by race for “xyz………….”
For now the immediate need is to focus on the Covid disparities, but watch this space for inequities and analysis on education, homelessness, the opioid crisis and so many more areas that need our collective scrutiny.