3.
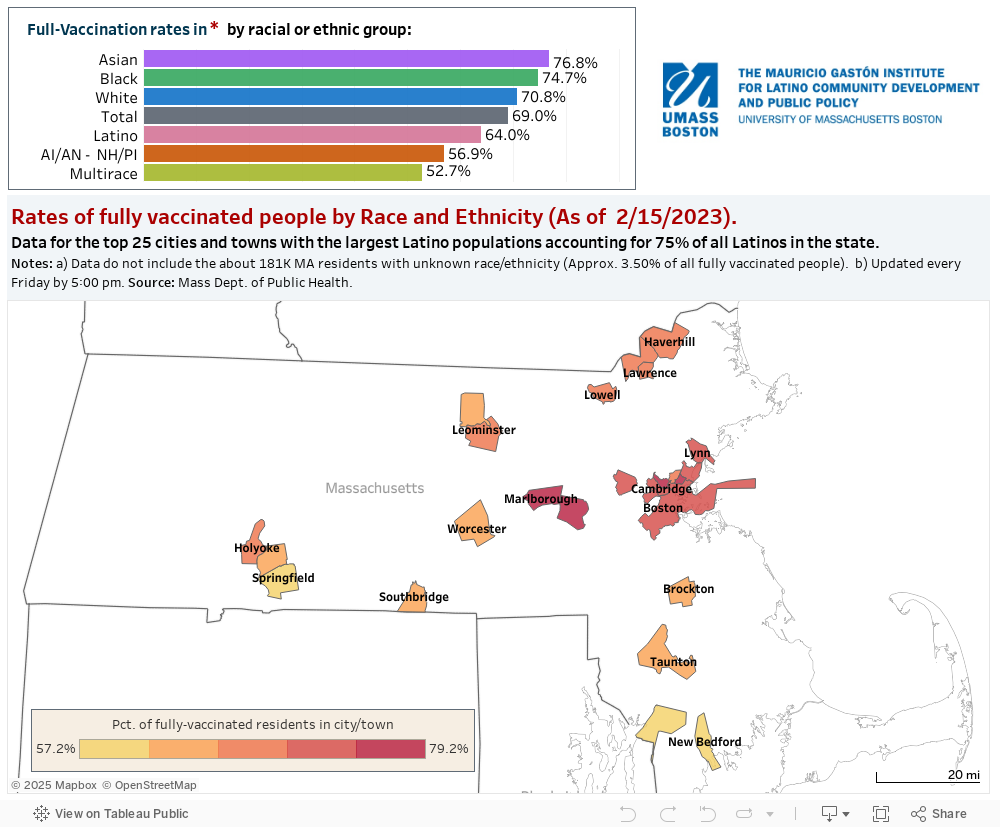
Map of the top 25 Latino cities with vaccination rates by Race/Ethnicity.
Why this interactive Map
This map of Massachusetts shows the rates of fully vaccinated people by Race and Ethnicity, for the top 25 cities and towns with the largest Latino populations, in the present moment. Its visualization allows to compare fully-vaccinated rates according to race and ethnicity in each one of the 25 top Latino cities, according to the latest data released by the MA Department of Health.
How to use this interactive Map
This dashboard displays the geographical distribution of the top 25 cities/towns with the largest Latino populations. You can use the mouse to select a city and explore rates of fully-vaccinated residents for each racial and ethnic group in the city. Using Ctrl+click you can select more than one city and the vaccination rates will be aggregated for the selected cities.